This tool offers the possibility to analyze and compare user-defined model scenarios with each other.
Numerical models are frequently used to plan, optimize and assess MAR facilities (Ringleb et al., 2016). Scenario analysis serves to evaluate various management solutions or to integrate climate, land use or urban change projections into the numerical model. This can be done by changing model boundaries e.g. pumping rates to represent the changing water demand, recharge rates and river discharge to reproduce climate or land use change. The workflow is based on the existing numerical groundwater flow and transport model tool T03. MODFLOW model setup and editor, where the model can be setup, run and calibrated. For scenario analysis, the Base Model can be cloned and edited to change boundary conditions by percentage. Besides that, it is possible to vary the boundary input by hand or upload CSV files.
The scenario management tool offers the unique possibility to compare two or more model runs with each other. For this, distinct results visualization options including the cross section view, the difference view and the time series view have been developed. Multiple scenarios can be evaluated in one project, where the visualization of model results can be turned on and off for each of the models. In that way, the occurring changes between the scenarios can be easily visualized.
The web-interface provides new possibilities for easy transfer of modelling results to local stakeholders and decision-makers, independent of location and software. By comparing various management options, system operators can take scientifically-based decisions without the need to get familiar with the often complex numerical model itself. The better informed, scientifically-based decisions can help to reduce the risks associated with MAR and improve the sustainable management of water resources. The presented tools were specifically developed to solve MAR-related issues but can also be used to solve other, general groundwater-related questions.
SCENARIO SETUP
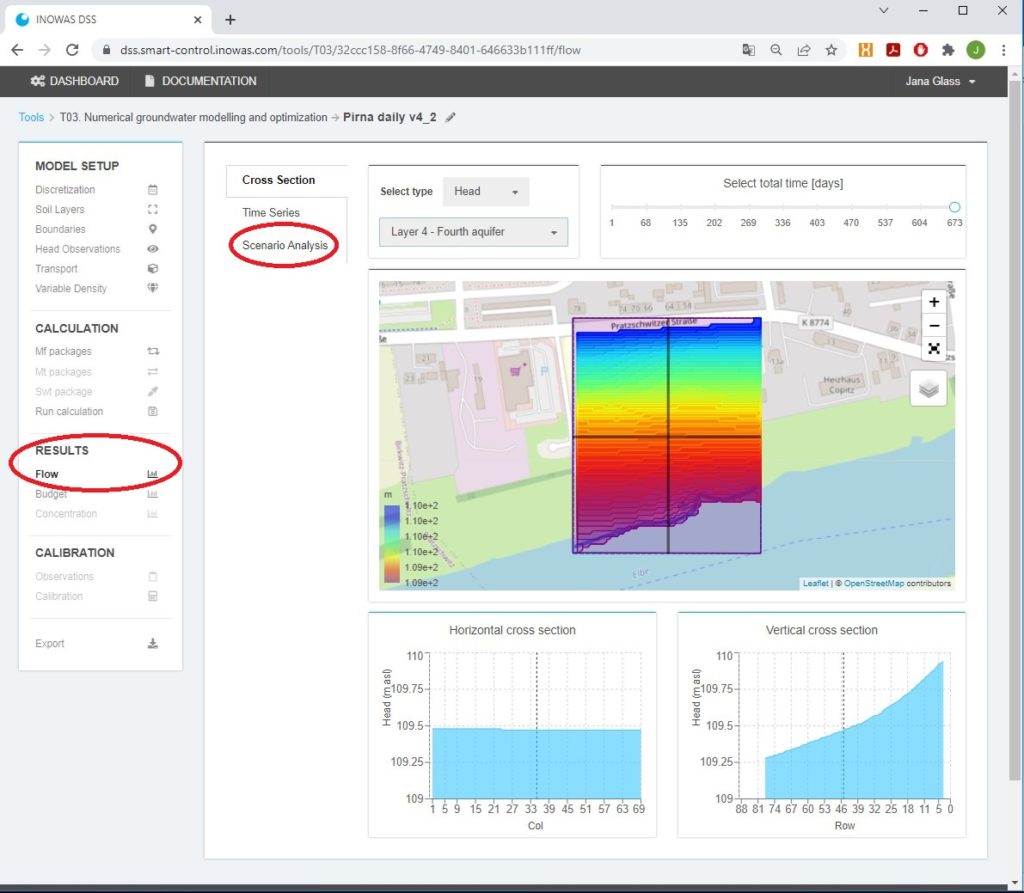
The first option to start a new scenario analysis is to go to the results section of your calculated numerical flow model (T03. MODFLOW model setup and editor) and click “Scenario Analysis”. Be aware, that this model will be handled as “Base Case” in the scenario analysis. A new scenario analysis will be created and you will be directed to tool T07.
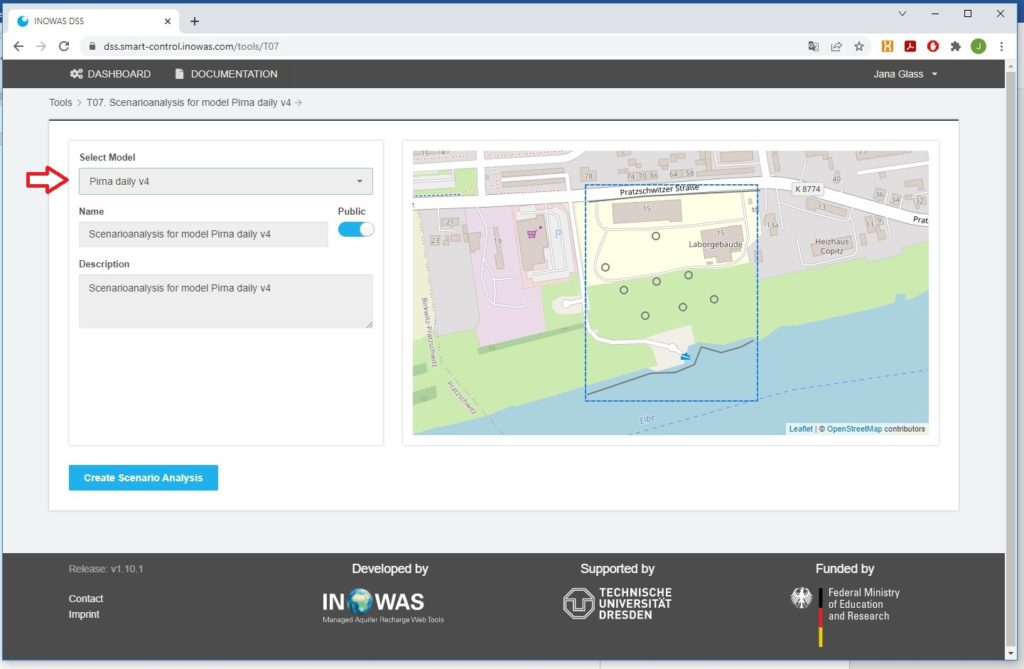
The second option is to go to tool T07 in the dashboard, create a new tool instance and pick the model that serves as basis for your scenario analysis from the drop down list. Be aware that you need to be the model owner, to start a scenario analysis for a model and to edit the model. If the model is not in the list, you first need to clone the model before you can initiate the scenario analysis. For this go to T03 in the dashboard and click “Clone” for the model you would like to edit and create a scenario analysis.
SCENARIO MANAGEMENT
A calibrated groundwater flow (and transport) model, here referred to as Base Case Scenario, can be cloned.
Scenarios can be checked (blue) and unchecked (white) to view the results in the main window of the application.
In contrast to a Base Case Scenario, the new scenario can also be deleted within this tool. For all features of the landing page of tool T07 see the following image:
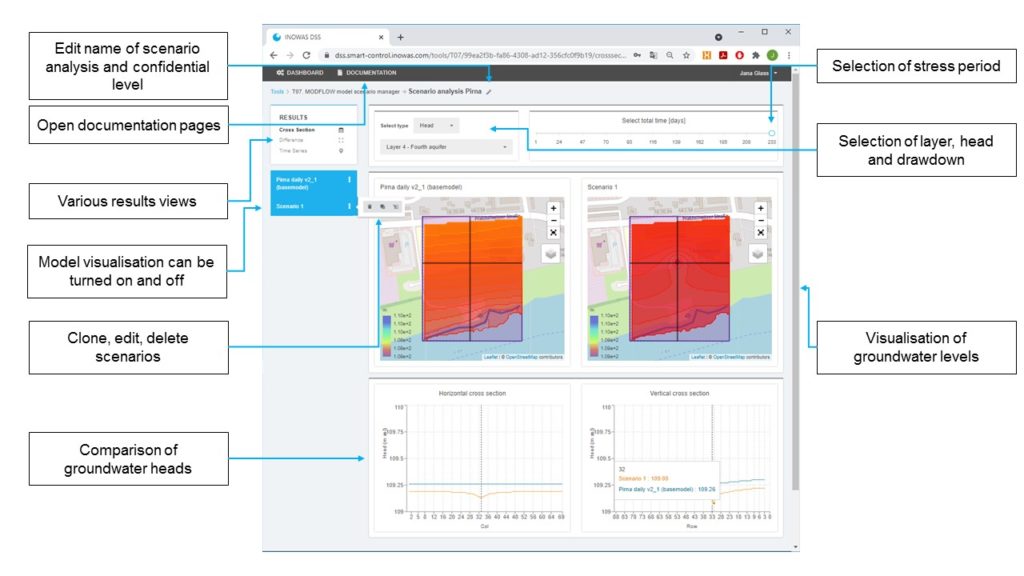
The new scenario can be renamed (title and description) and relevant boundary conditions can be edited in the Model Editor View (which looks the same as T03). To reach the Model Editor View, click on “Edit”.
Boundary conditions can be updated by hand, uploading a CSV file or by changing the values by a certain percentage. This is especially handy if you only have approximate data for the scenario and want to get a rough and quick estimate what happens e.g. with the groundwater levels if pumping is increased by 10%. For this, go to the boundary you want to change and type in the field “Change by %” the desired percentage. As soon as you click out of the field, the percentage is automatically applied to all values of the boundary. If you validated, that you typed the correct value, you have to save the changes.
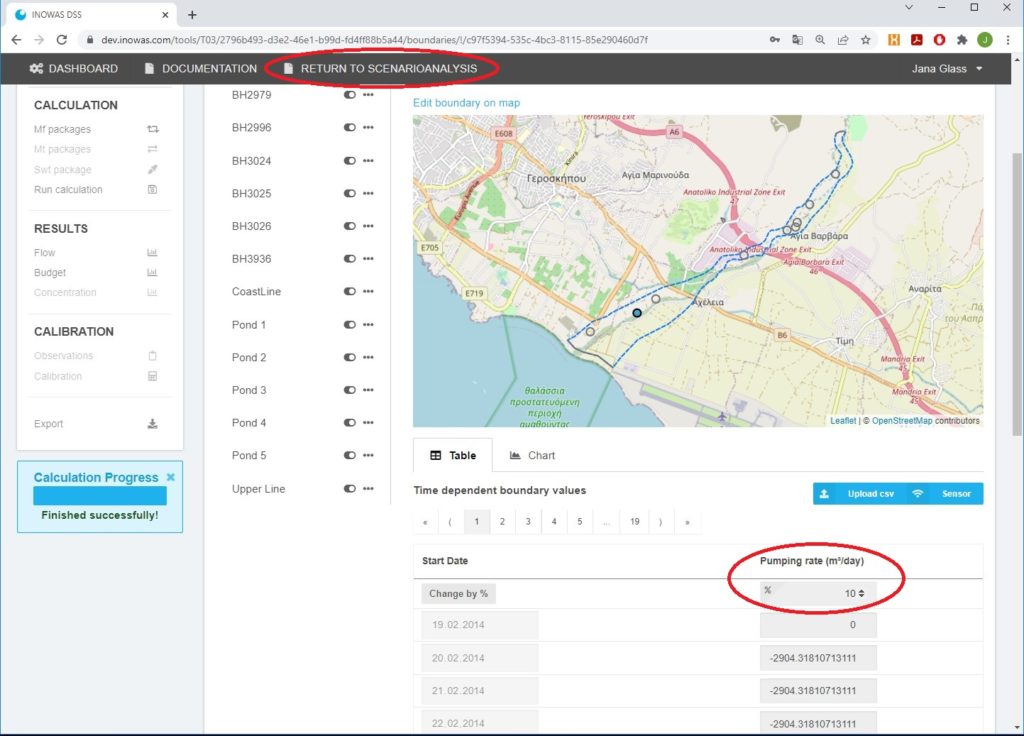
The new scenario can than be run to receive simulation results with the modified boundary conditions. After the model run, click on “Return to Scenario Analysis” (in the top of the window) to compare the results of the various scenarios.
SCENARIO ANALYSIS
Model results from various scenarios can be viewed and compared. At the moment, these include groundwater levels and drawdown of the various layers.
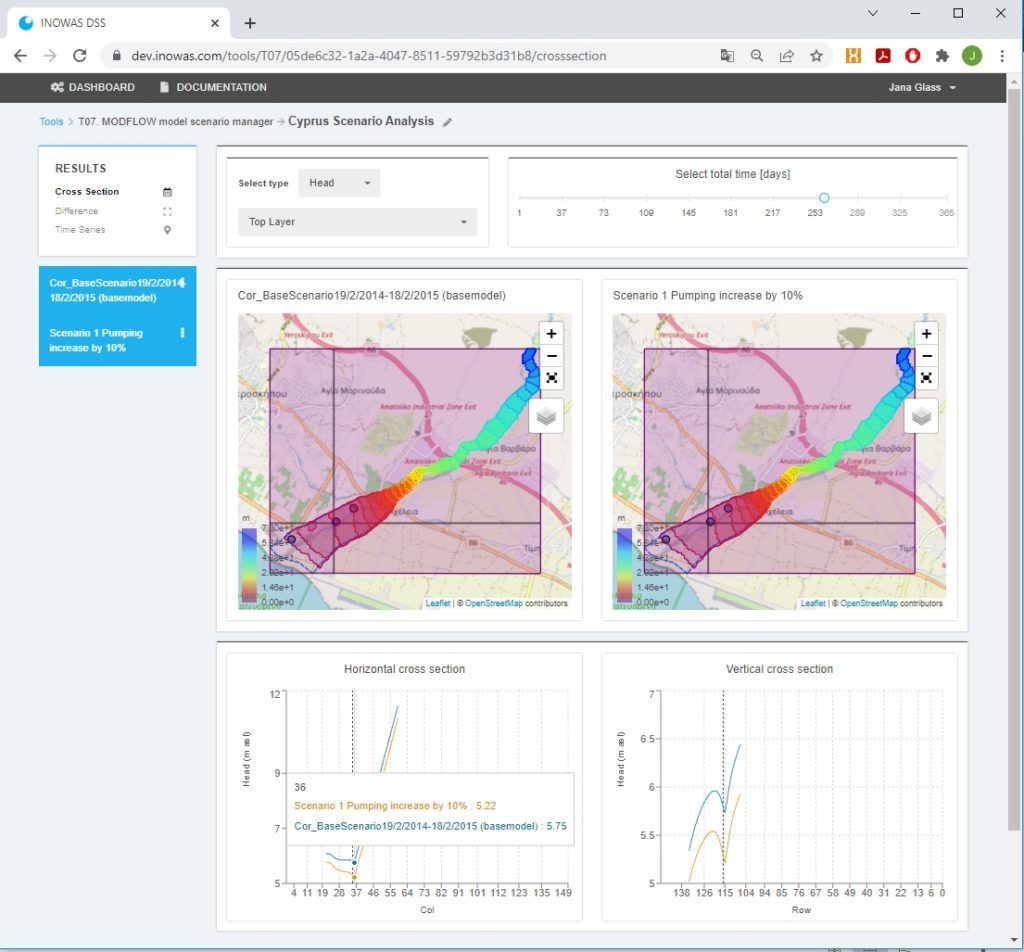
Cross Section
Cross sections at user-specified locations allow the comparison of simulation results for the selected model layer at a specified time step.
The user can decide which scenarios should be compared and can choose multiple scenarios for comparison.
The map shows the groundwater heads or drawdown for the selected scenarios. In the bottom a horizontal and a vertical cross section are displayed comparing the drawdown or groundwater head for the chosen scenarios. The precise groundwater heads can be visualized by moving the mouse cursor over the graph.
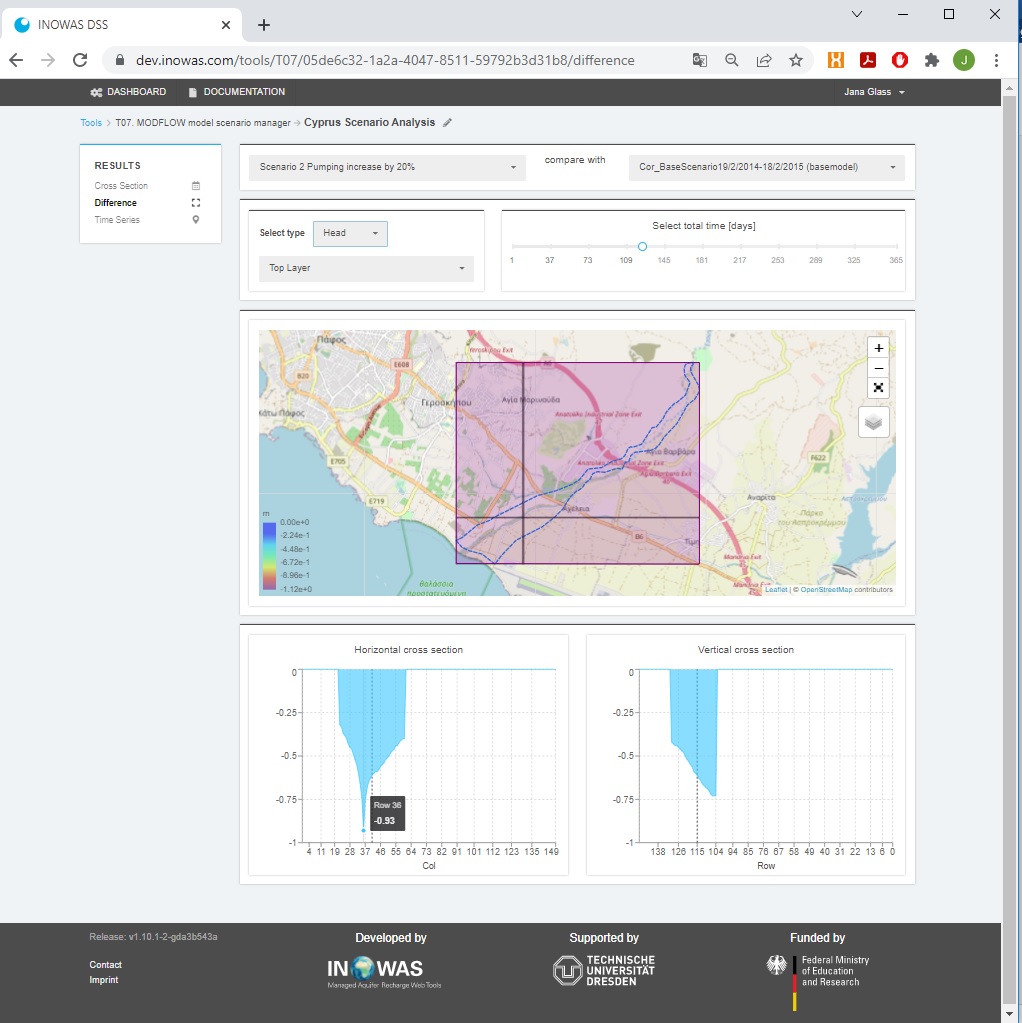
Scenario difference
The scenarios difference view allows to display the groundwater level changes between various scenarios at a specified time step. The user needs to choose two scenarios from the list as well as the time step for which the scenarios will be compared.
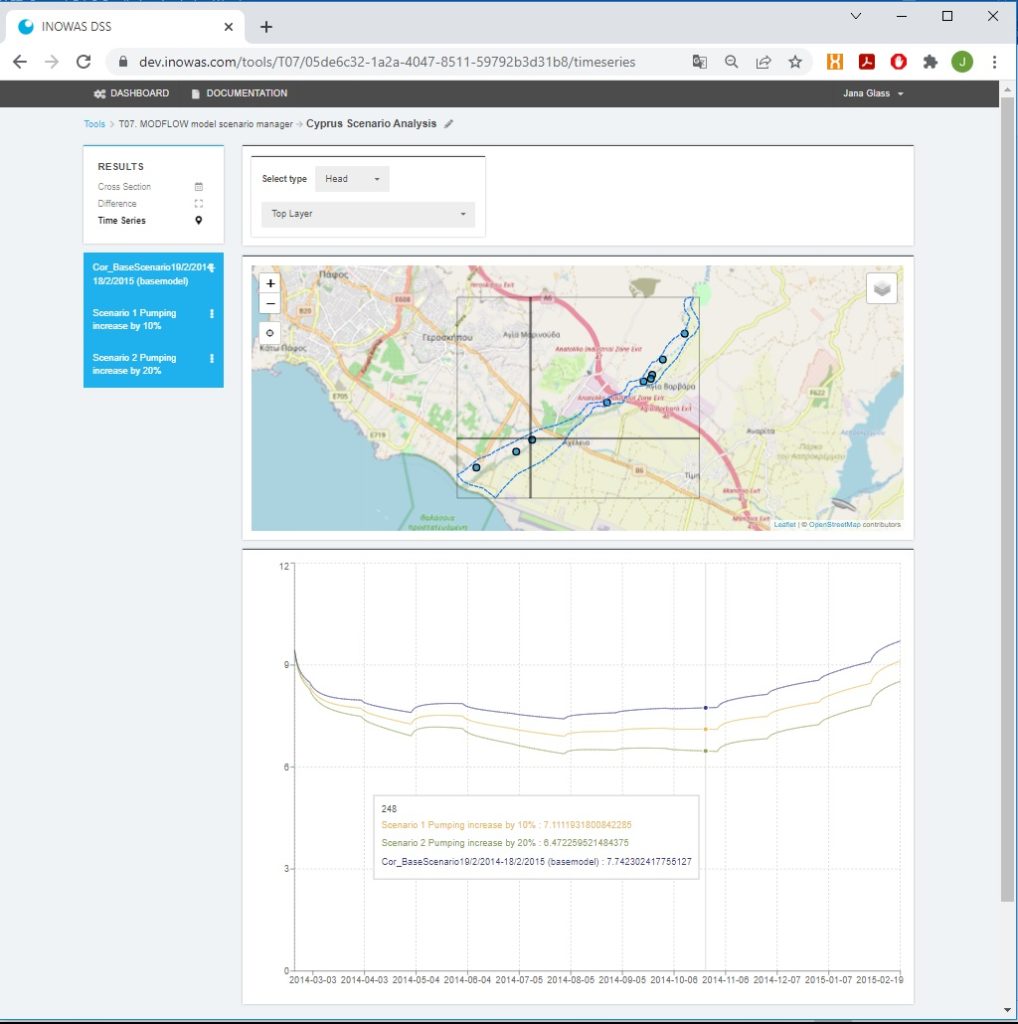
Time series view
The time series view was developed to display the groundwater head over time at user-specified locations for various scenarios. The user can choose various scenarios for comparison. The precise groundwater heads can be visualized by moving the mouse cursor over the graph.
TUTORIALS
Download our tutorial and learn step-by-step how to use the INOWAS tool “T07. MODFLOW model scenario manager” for your project. Please be aware, that it is required to setup and run a numerical groundwater model using Tool T03. MODFLOW model setup and editor before a scenario analysis can be started.
- Tutorial 1. How to setup a steady state groundwater flow model. Read more.
- Tutorial 2. Transient groundwater flow model and scenario analysis. Read more.
References
- Glass, J., Junghanns, R., Schlick, R., Stefan, C. (2022) The INOWAS platform: A web-based numerical groundwater modelling approach for groundwater management applications. Environmental Modelling & Software, 155, 105452. http://dx.doi.org/10.1016/j.envsoft.2022.105452
- Ringleb, J., Sallwey, J., Stefan, C., 2016. Assessment of Managed Aquifer Recharge through Modeling—A Review. Water 8, 579. https://doi.org/10.3390/w8120579
Parts of this tool were developed within the frame of SMART-Control, a WaterJPI project. For further information please visit:
www.smart-control.inowas.com