This tool encompasses a web-based monitoring system developed to integrate time series data into the INOWAS platform. Real-time sensors can be connected to the INOWAS platform and time series data can be uploaded. The data can be visualized, processed, downloaded and prepared for further usage, e.g. as a boundary or observation point in a real-time groundwater flow model.
Sensor Setup
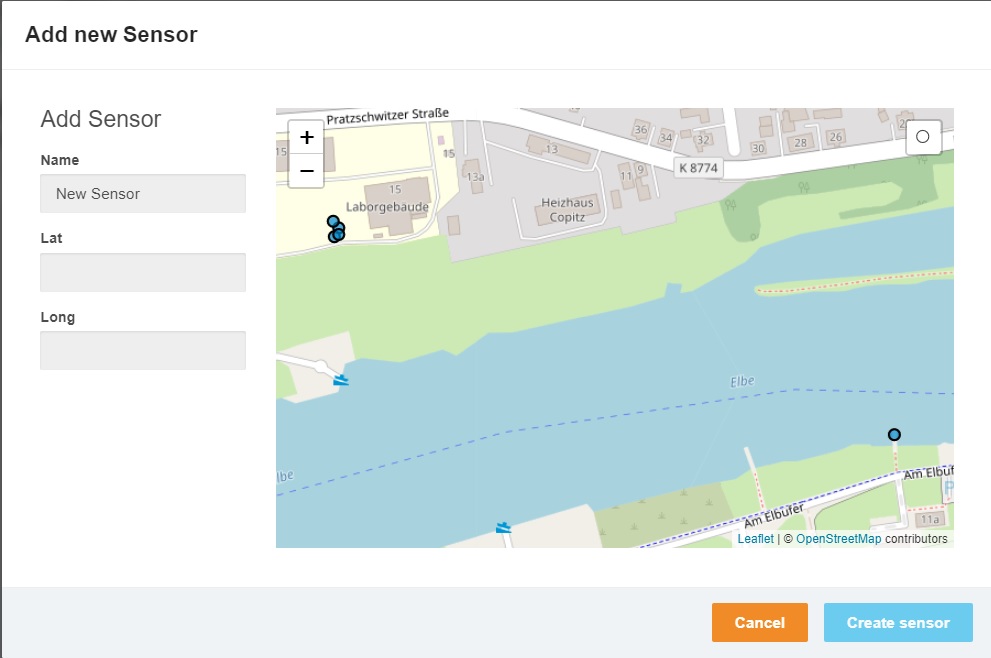
Add Sensor
A new sensor can be added by using the “+Add” button. The sensor location needs to be included by clicking on the specific location on the map. The exact location can be edited and specified.
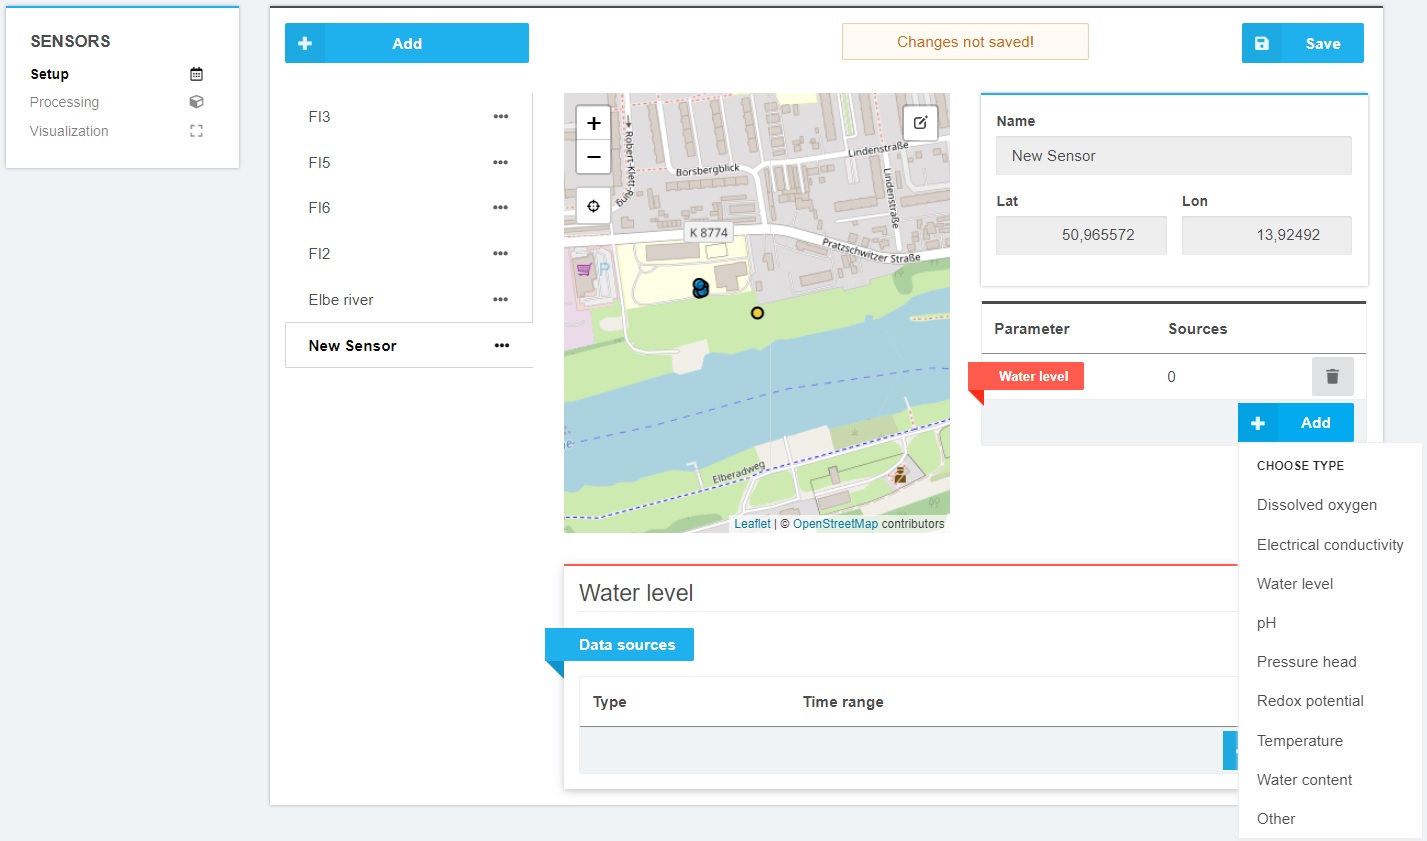
Change metadata and add parameter
After creating the sensor, the metadata including the name and location (WGS84) can be edited and parameters can be added using the following categories:
- Electrical conductivity
- Water level
- Pressure head
- Dissolved oxygen
- Temperature
- pH
- Water content
- Redox Potential
- Others – custom parameters can be defined
Add data sources
For each parameter, time series data can be added as csv or as online sensors using a server connection.
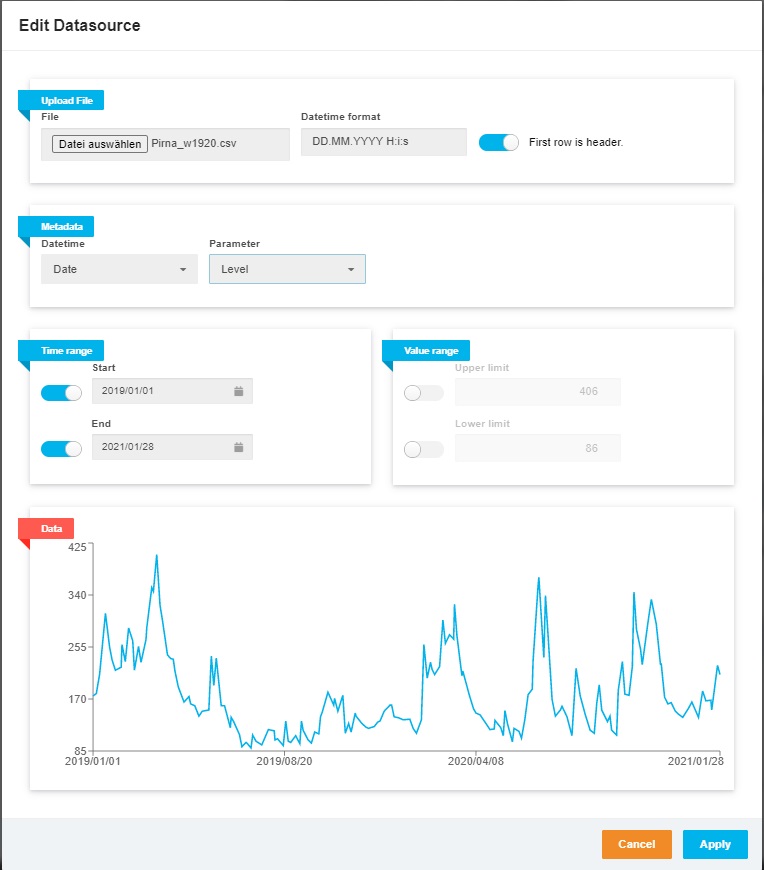
CSV Upload
To upload a time series via CSV, click on Data Source “+Add” and choose the type “file”. The following window will appear where you can specify the CSV file, the date-time format and the column of the CSV file which corresponds to the date-time as well as the parameter. In addition, the desired time range which should be uploaded (default is the whole time series saved in the CSV) and the value range can be specified. After clicking “Apply”, the data is added to the platform.
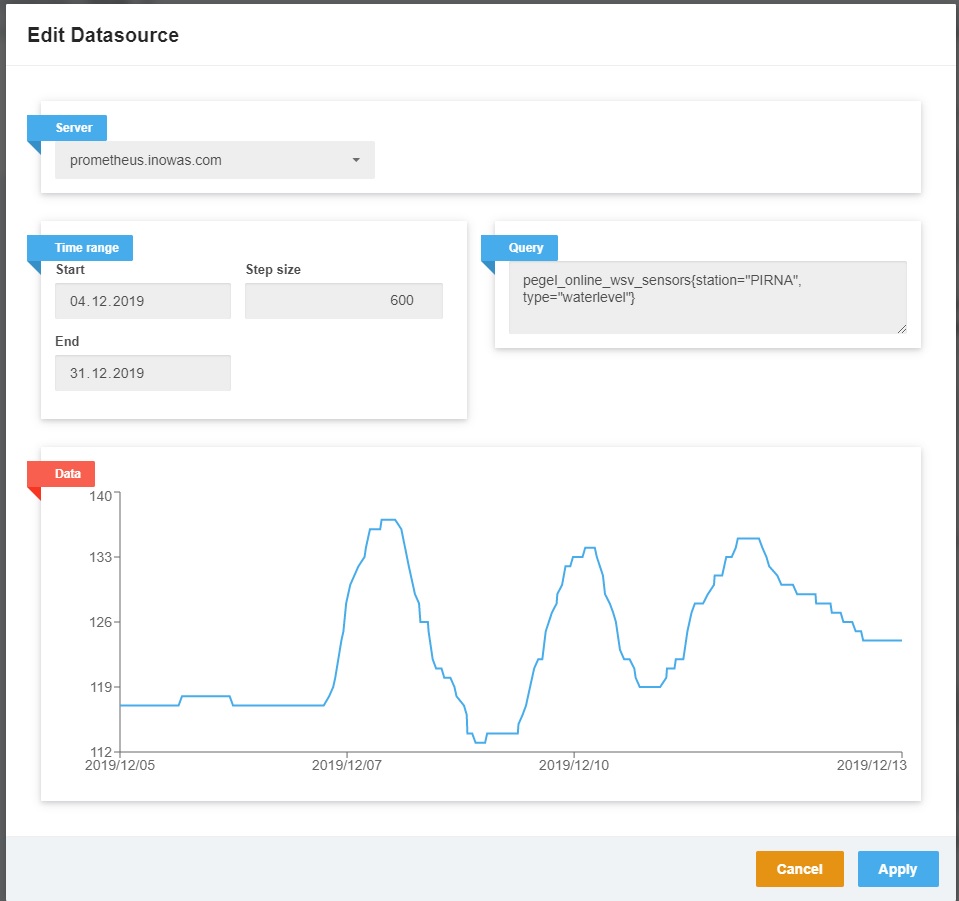
Real-time data
To add real-time sensor data, the sensor needs to be previously connected to the INOWAS server (prometheus or http API). If you would like to add your own online sensor, please contact the INOWAS team.
Time series data can be added using a prometheus query as shown below. Here the Elbe river water level provided by Pegelonline WSV (https://www.pegelonline.wsv.de) is connected to the INOWAS platform via the Prometheus server.
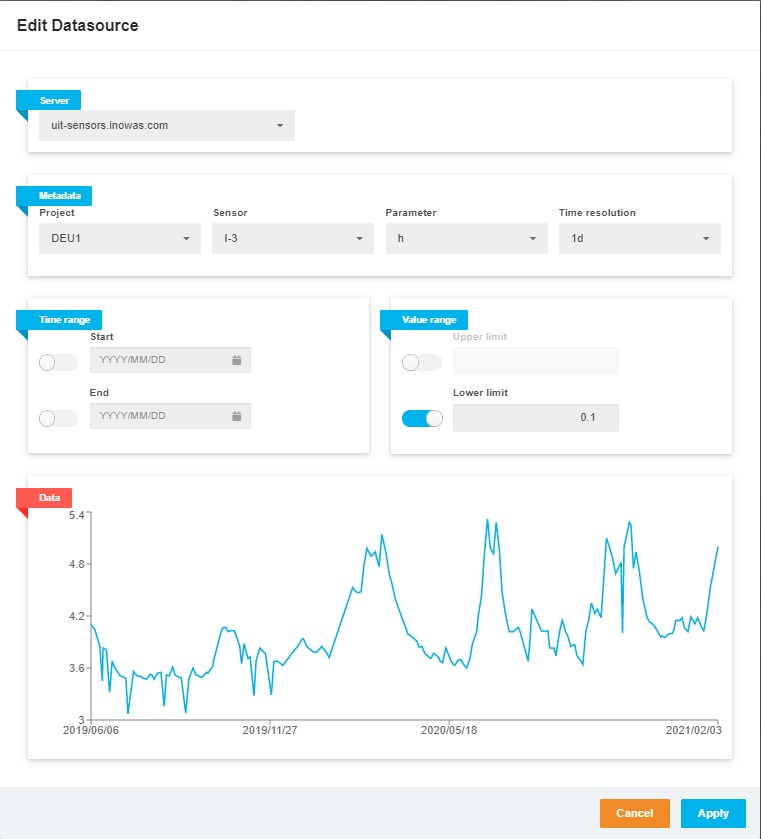
Groundwater sensors of the company UIT can be connected via FTP and SensoWeb to the INOWAS platform. For that the data source type “Online” is chosen. The specific project, sensor and desired parameter needs to be selected. The time, value range and time resolution can be specified.
Various data sources
Various data sources of mixed data types for one parameter can be included as shown in the following Figure. Here, a historical time series of water level is combined with an online sensor which is added through the INOWAS Prometheus service.
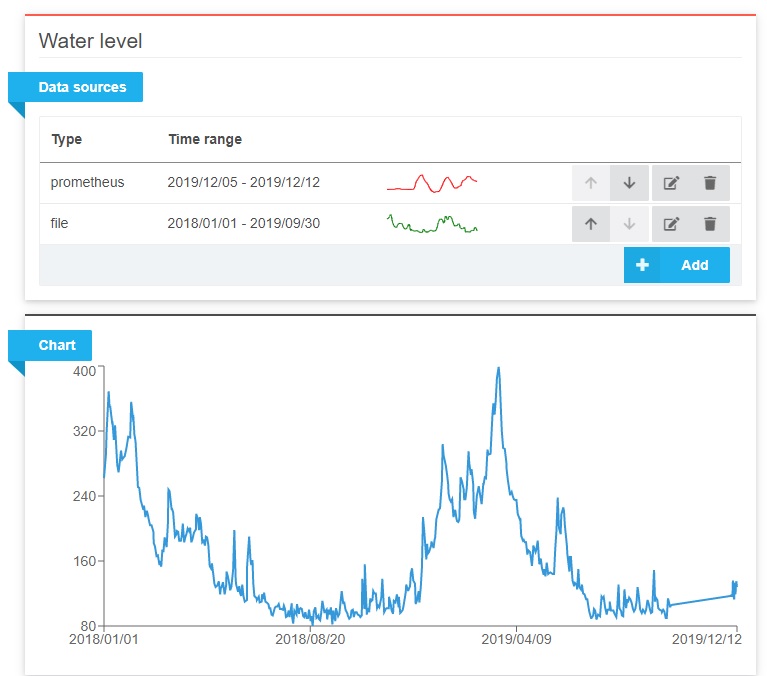
The data of the various data sources need to have the same unit (e.g. water level in cm). Please be aware, that if time periods of various data sources overlap, the second data source (bottom) overwrites the values of the first data source (top). You can change the order of the data sources using the “up” and “down” arrows. If no time periods overlap, the data of the various data sources are combined to one time series.
Sensor Data Processing
The uploaded data can be processed in this section. Processing is divided into time and value processing.
Value processing comprises all processing algorithms which directly influence the values of a time series. The following processing operations are implemented:
- + : add a constant value
- – : substract a constant value
- * : multiply by a constant value
- / : divide by a constant value
- < : filter all data points that are smaller than the value
- <= : filter all data points that are smaller or equal to the value
- > : filter all data points that are bigger the value
- >= : filter all data points that are bigger or equal to the value
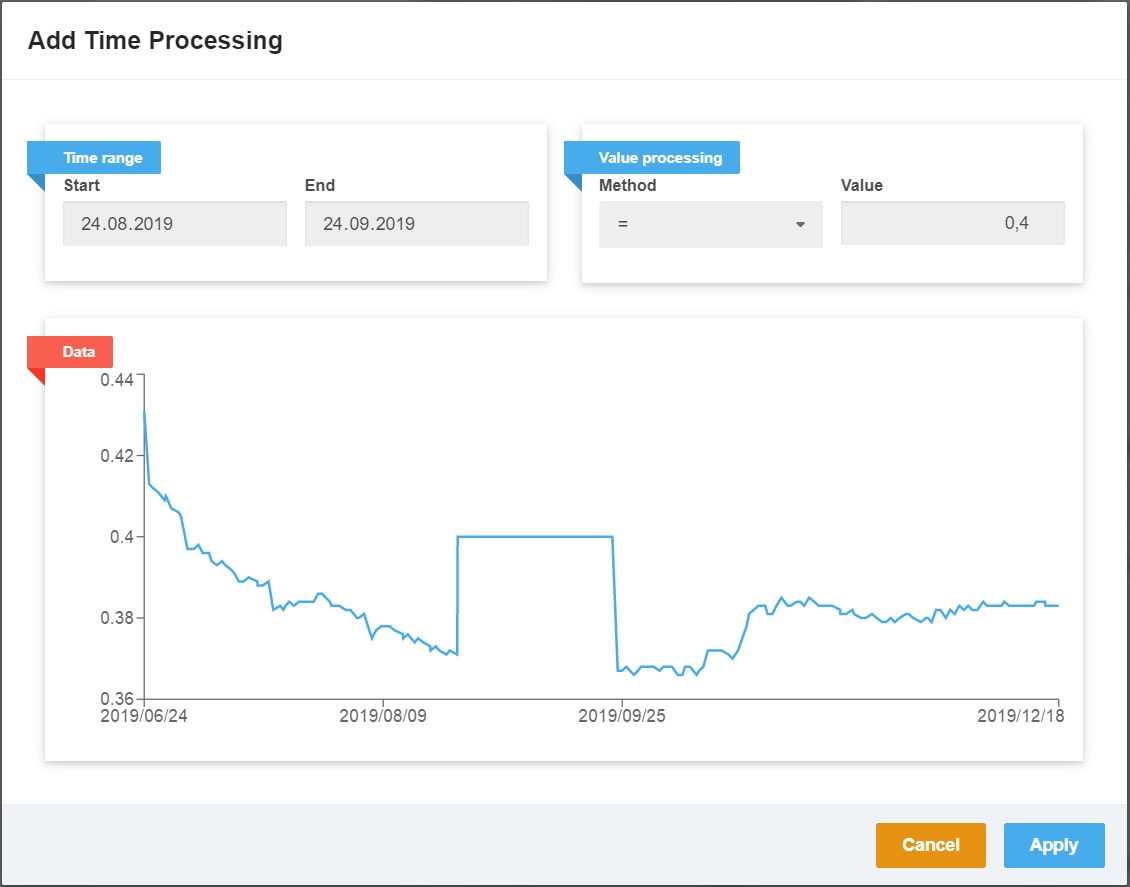
- = : assign a constant value
The operation can be either applied to the whole time series length or the start and end date can be specified (see below).
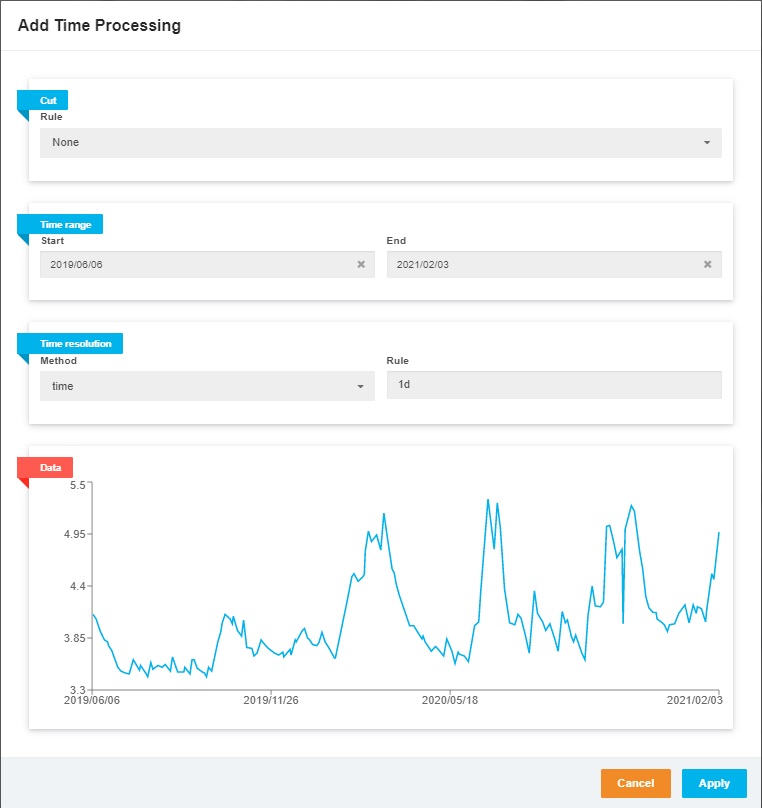
In the time processing section, gaps in the time series can be filled (interpolated), the time series can be cut to a desired length and resampling to a different time resolution can be done. For this the interpolation method and the time resolution (Rule) needs to be defined.
The interpolation methods currently implemented comprise:
- cubic
- linear
- nearest
- quadaratic
- slinear
- time
- zero
The documentation for the various interpolation methods can be found in the Python Pandas documentation. The time resolution of the new, processed time series needs to be given as an integer followed by the corresponding time discretisation:
- t : second
- min : minutes
- d : days
- w : weeks
- m : months
- y : years
Sensor Data Visualization
The visualisation section currently includes a graph, where various parameters and sensors can be displayed. The parameter for right and left y-axis can be defined separately. The sensors which should be displayed can be selected. The graph can be exported and saved in a JPEG or the displayed data in a CSV file.
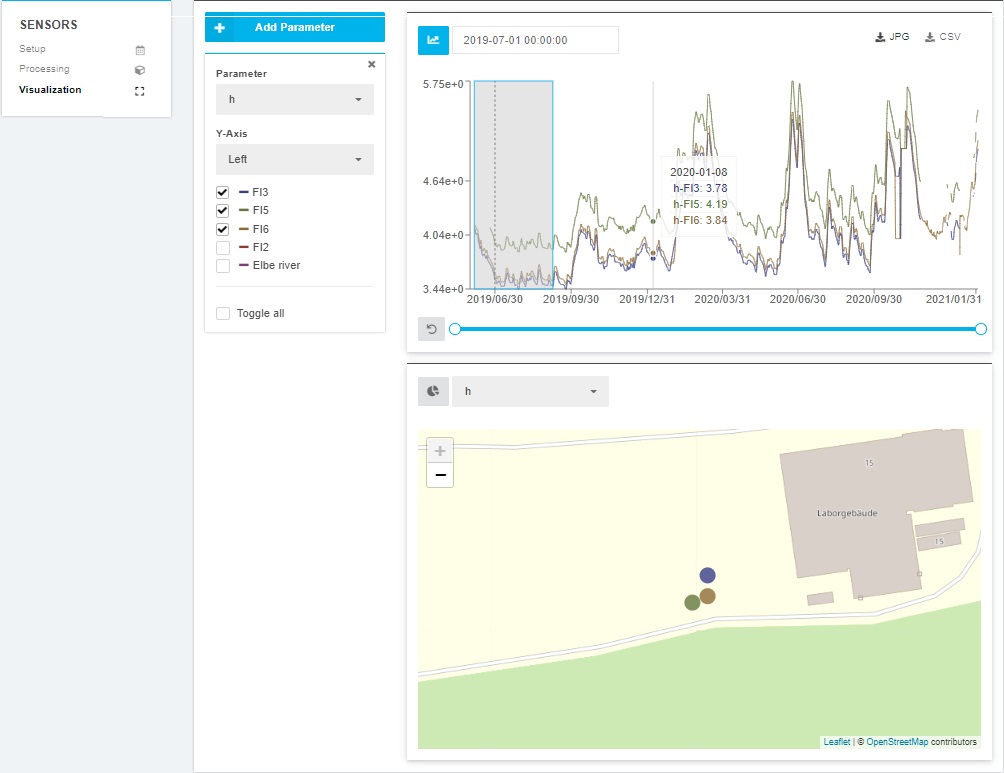
In addition, the spatial distribution of the sensor data can be displayed in a map, where the time steps are running automatically.
Tutorial
There is a step-by-step tutorial available on how to create sensors, add parameters and data sources and process and visualize time series data. The tutorial is available under the following link: http://inowas.webspace.tu-dresden.de/tutorials/tutorial-5-real-time-monitoring/
This tool was developed within the frame of SMART-Control, a WaterJPI project. For further information please visit:
 www.smart-control.inowas.com