The tool helps to quantify the pathogen occurrence in source water and their removal by various treatment steps at MAR facilities by using a probabilistic approach. The interactive web-based QMRA tool supports the evidence-based risk assessment to minimize water-related infectious diseases.
This tool was developed within the frame of SMART-Control, a WaterJPI project. For further information please visit: www.smart-control.inowas.com
The documentation of the tool is based on the SMART-Control Deliverable D4.3.
Introduction
Quantitative Microbial Risk Assessment (QMRA) is recognized as an evidence-based approach to minimize water-related infectious diseases. The risks caused by pathogenic microorganisms can be assessed which supports decision-making related to the microbial safety of water systems. The web-based QMRA tool was developed to support the implementation of QMRA through an interactive, easy-to-use, and guided web-browser based application. The QMRA tool allows the quantification of pathogen occurrence in source water and their removal by various treatment steps and is based on a probabilistic risk assessment.
Due to the many preset parameters, microbial risks at sites with little known information can also be calculated. Based on the findings from the model, problem and risk areas can be identified and protective measures prepared.
Parameter input
Inflow concentration of pathogens
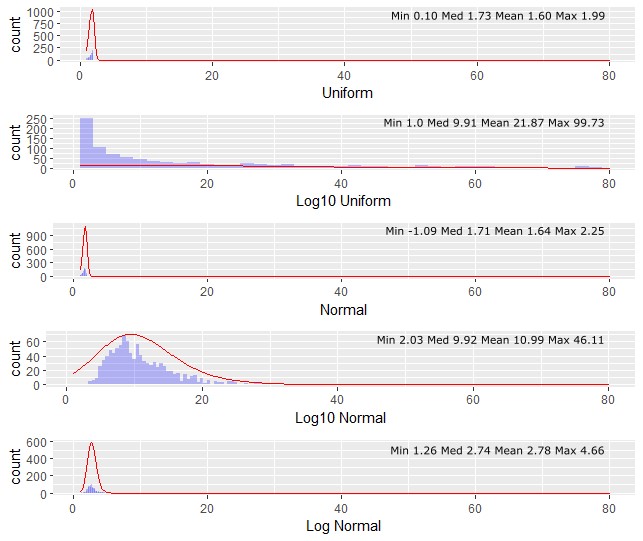
Inflow concentrations of the pathogen to the treatment scheme are entered as absolute minimum and maximum concentration per litre and are required for all pathogens that should be used for QMRA. Currently, one of the following probability density functions (PDF) can be selected by the user:
- Uniform: provides a constant probability density function, the provided absolute “min” and “max” values are in case minimum concentration is 0 replaced with 0.01; in case maximum concentration is 0 it is replaced with 0.1
- Log10 uniform: same as uniform but all values log10 transformed
- Normal: the required parameters mean and standard deviation are derived from the provided absolute min/max values as follows:
- “min”: if the minimum concentration is 0 it is replaced with 0.01
- “max”: if the maximum concentration is 0 it is replaced with 0.1
- “mean”: (min+max) /2
- “sdev”: abs(max – mean) / 1.644854, assuming that 90% of all random values lie between min and max
- Log10 normal: same as normal but all values log10 transformed
- Log normal: same as normal but all values log2 transformed
Total variability in pathogen concentration for inflow concentration is difficult to assess, because it can be unclear whether measurements cover the full range of microbial concentration (possible unobserved values). Low pathogen concentrations and the irregular occurrence of pathogens contributes to the difficulties in capturing this variability. Moreover, some sites may not have any pathogen data and are dependent on assumptions. At data scarce sites, it is recommended to use “log10 uniform”, because compared to the other it largely overestimate the provided concentration range. In contrast, the “log10 normal” distribution could be used for simulating “peak” system behavior as it overestimates the maximum concentration by approximately 250% compared to the maximum value entered by the user. The impact of different PDFs on the inflow concentrations is shown in Figure 1.
For further details the reader is referred to the documentation website of the R function create_random_distribution[1] within the R package kwb.qmra[2].
Treatment steps
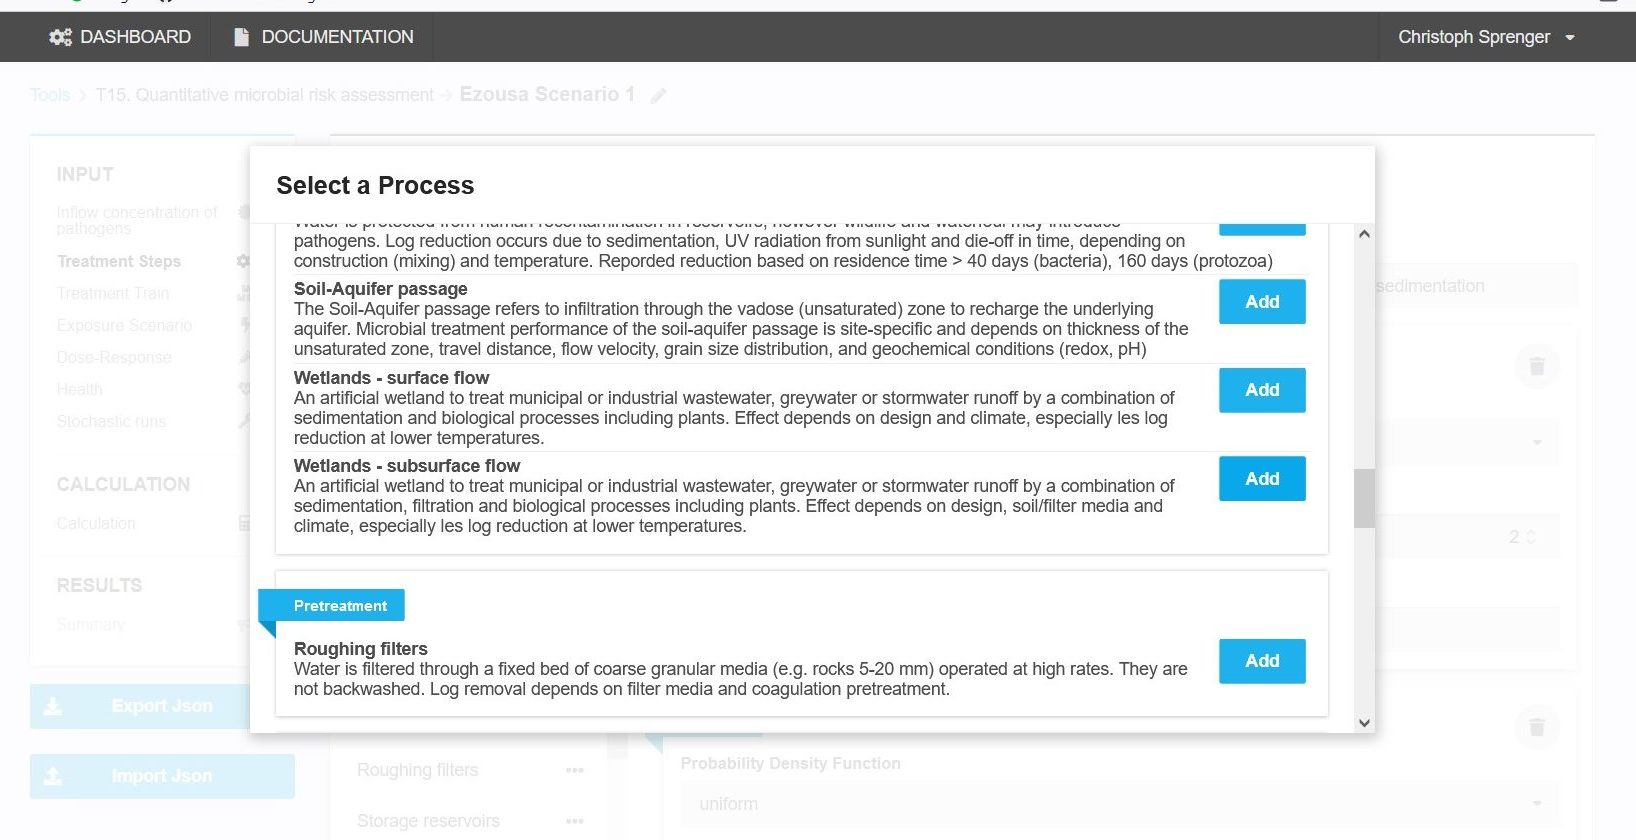
For each treatment process the log10-removals for at least one of the three different pathogen groups (i.e. bacteria, protozoa, viruses) need to be defined. The user can define a new treatment process or select from pre-defined literature based removal performance associated to the different treatment steps. Pre-defined treatments are available by clicking on list icon next to “Add process” button. There are over 25 treatment steps available covering the following groups:
- Coagulation, flocculation and sedimentation
- Filtration
- Natural Attenuation
- Pre-treatment
- Disinfection
- Primary and
- Secondary treatment
Natural attenuation e.g. includes bank filtration, soil-aquifer passage and wetlands. Each treatment step is briefly described (Figure 2) and substantiated with literature sources.
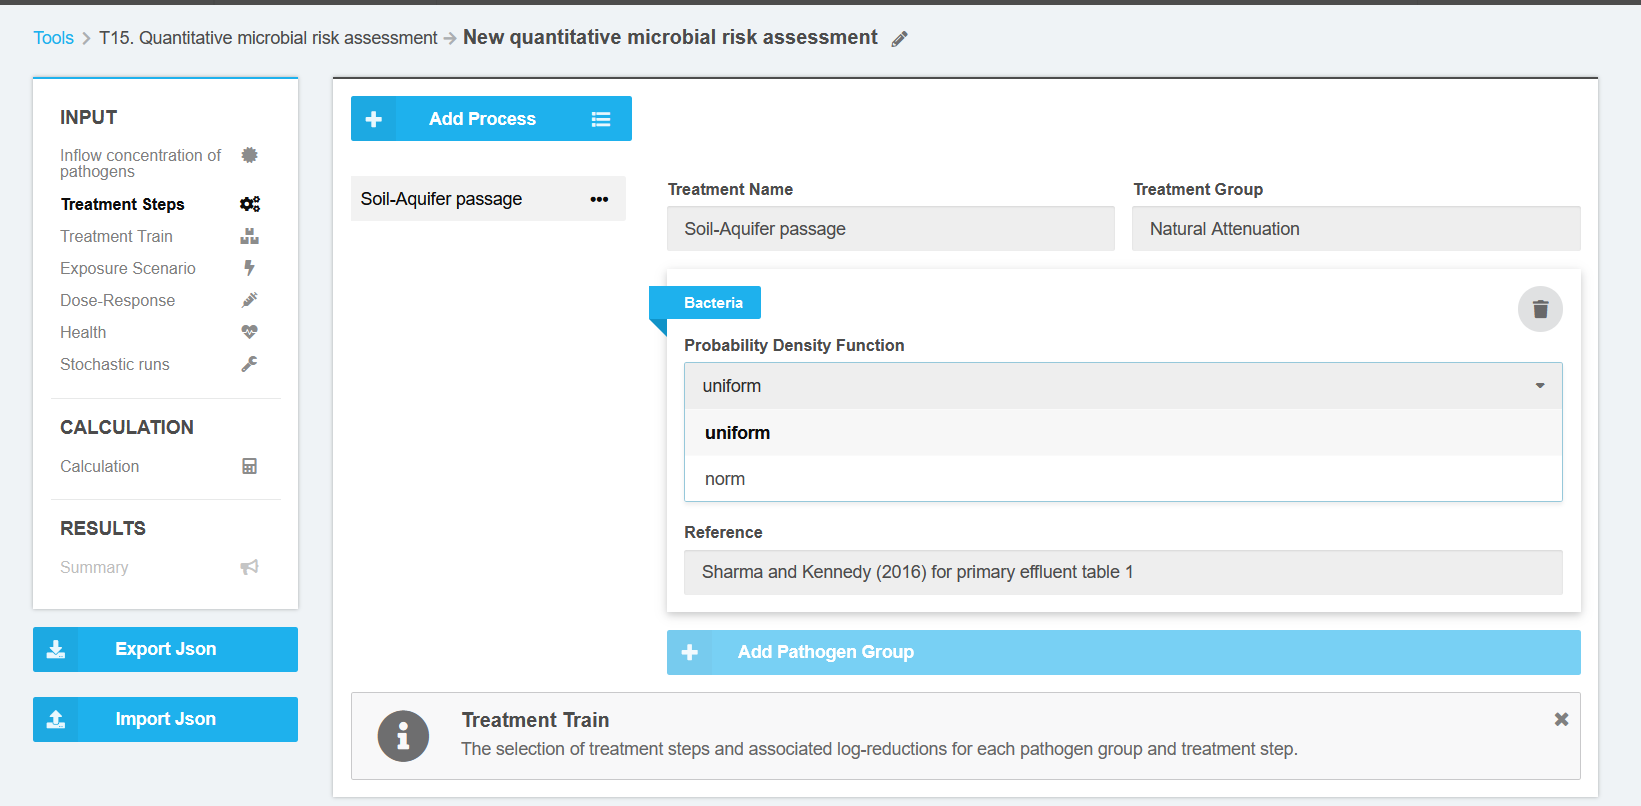
After selecting the required treatment steps it is necessary to enter Log Removal Values (LRV) for each pathogen and treatment step. The available PDF are limited uniform and normal distribution function (Figure 3).
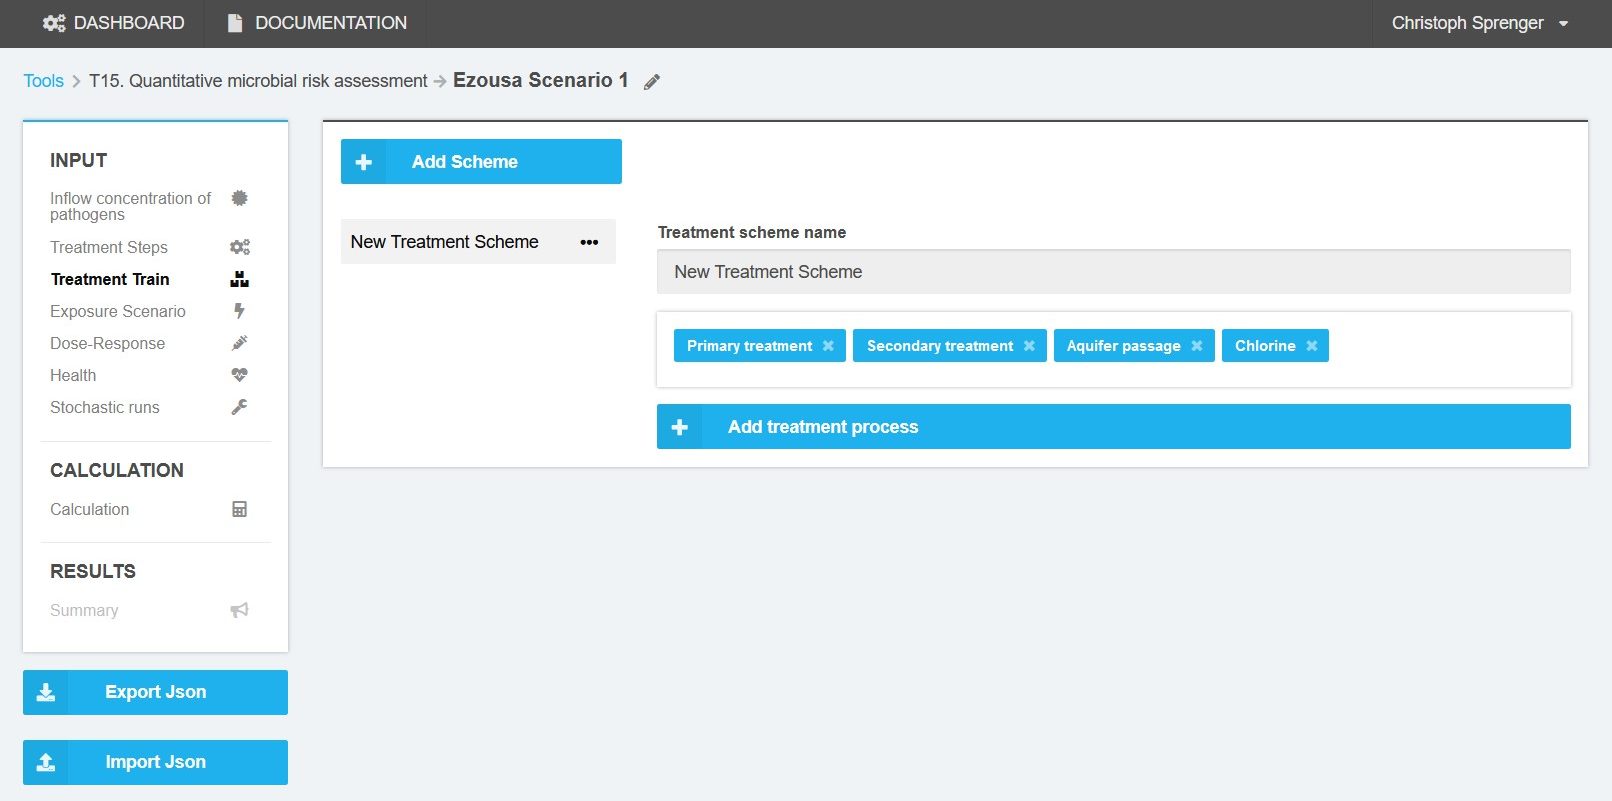
Treatment train
Treatment steps can be combined to a treatment train or treatment scheme (Figure 4). The user may construct several treatment trains. All selected treatment trains will be considered in the QMRA calculation. The order of the treatment steps does not play a role in the calculation.
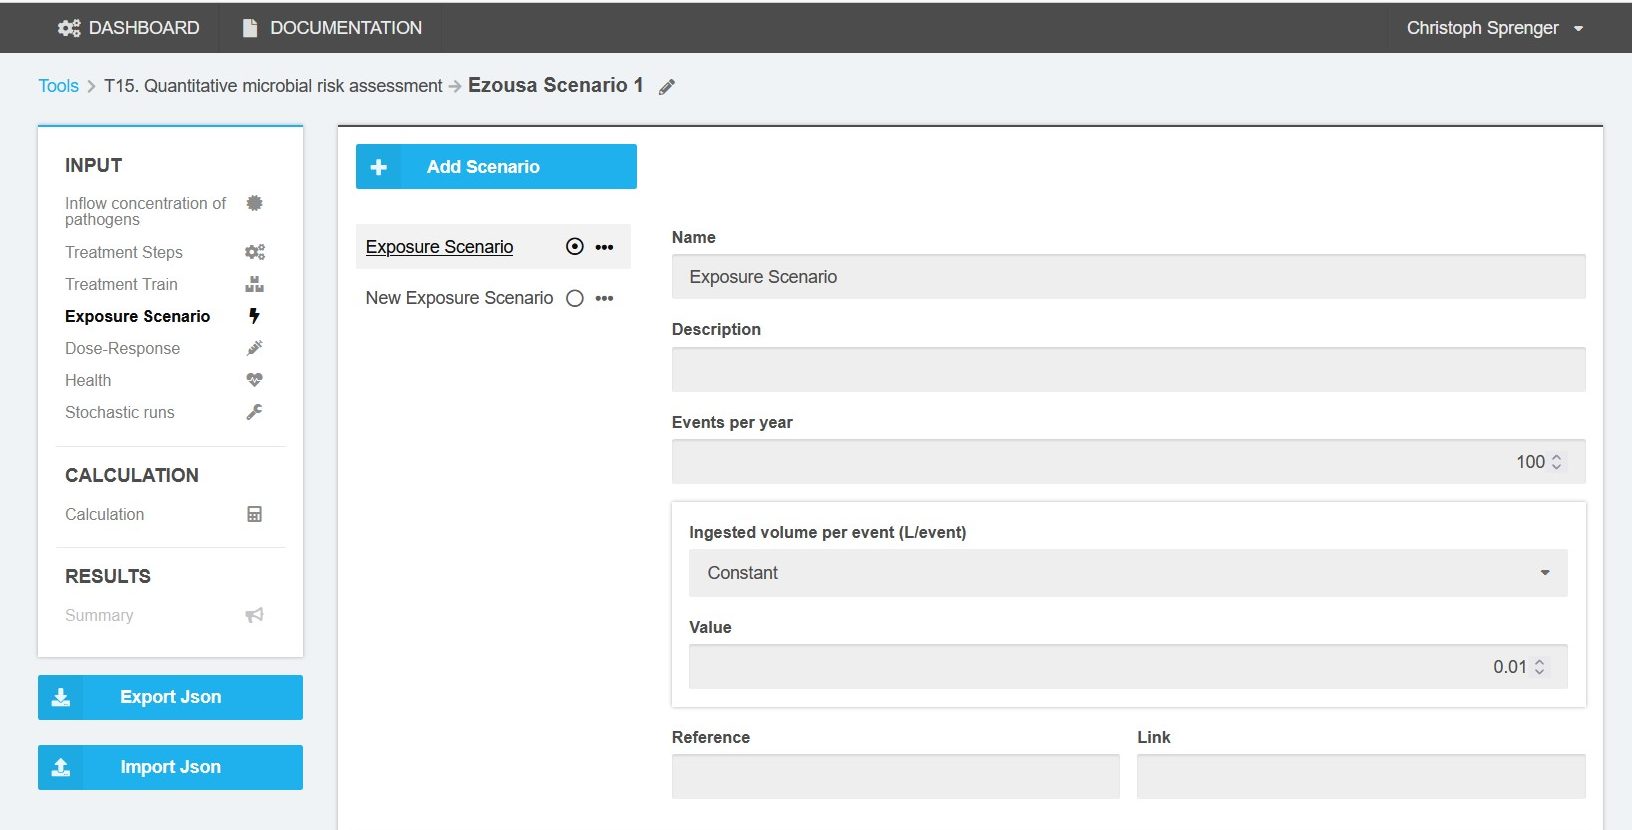
Exposure Scenario
The number of exposures per year and the ingested volume per event can be defined as fixed value or by following a pre-defined distribution. There are eight pre-defined exposure scenarios from drinking water to irrigation water and domestic end-use. The pre-defined exposure scenarios are accessible by clicking on the “Add Scenario” button. Once selected the exposure scenario can be switched to active by clicking on the “Toogle” button. Only one exposure scenario per simulation can be selected at a time (Figure 5).
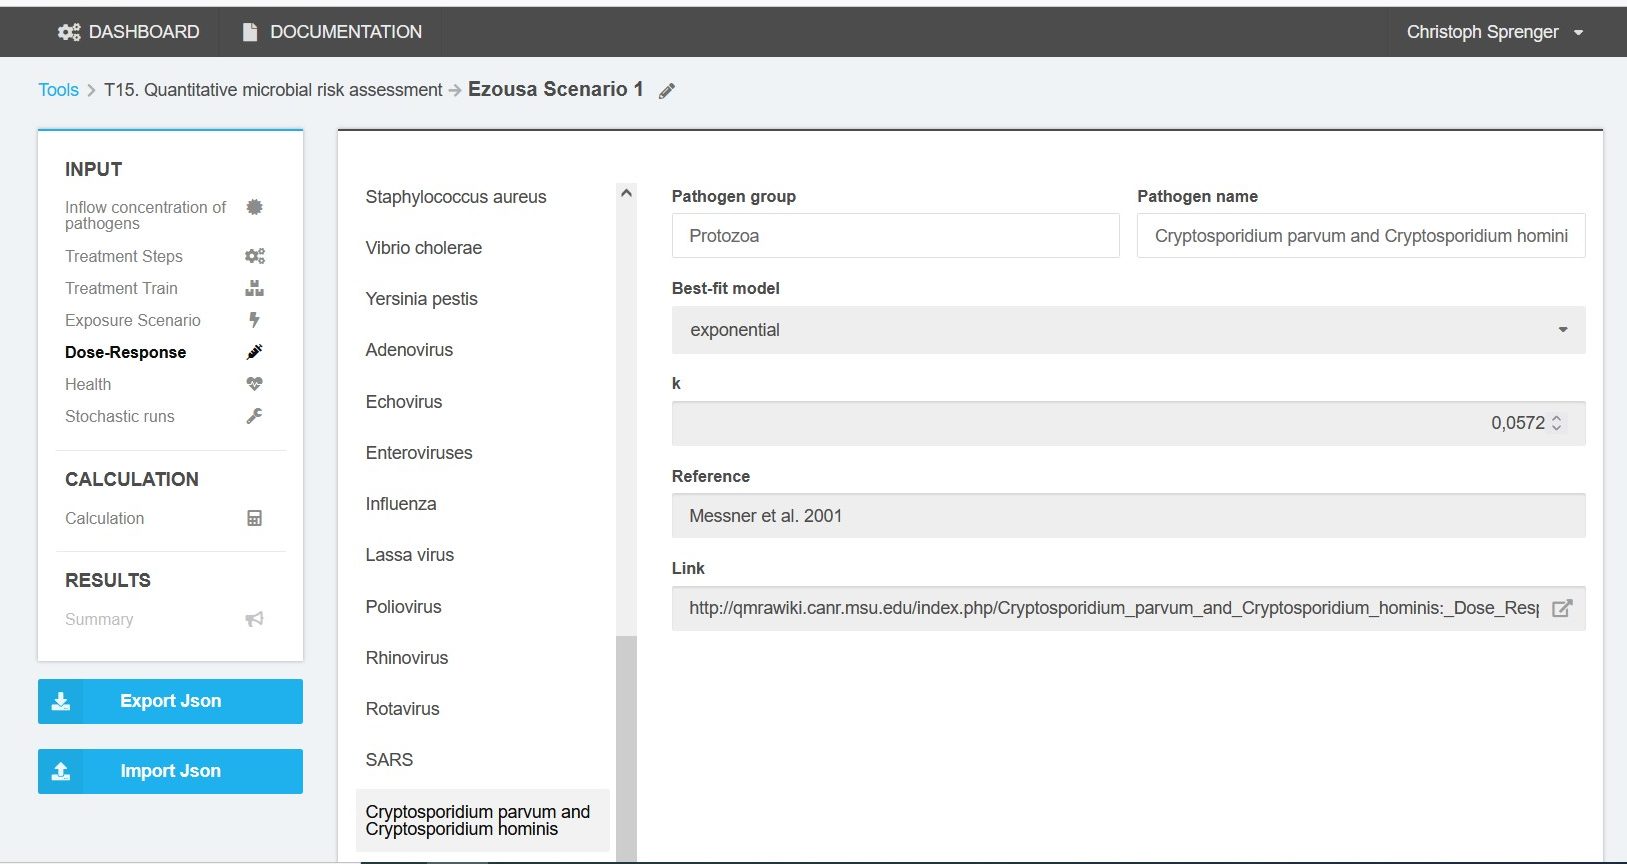
Dose-Response
The dose-response models are based on experimental data. The dose-effect relationships can be approximated for each pathogen by exponential binomial formulae or beta Poisson distributions. Parameters for each pathogen are taken from QMRAwiki (2016)[3] (Figure 6).
Dose-response models are defined for the pathogens that are toggled active in the inflow concentration section.
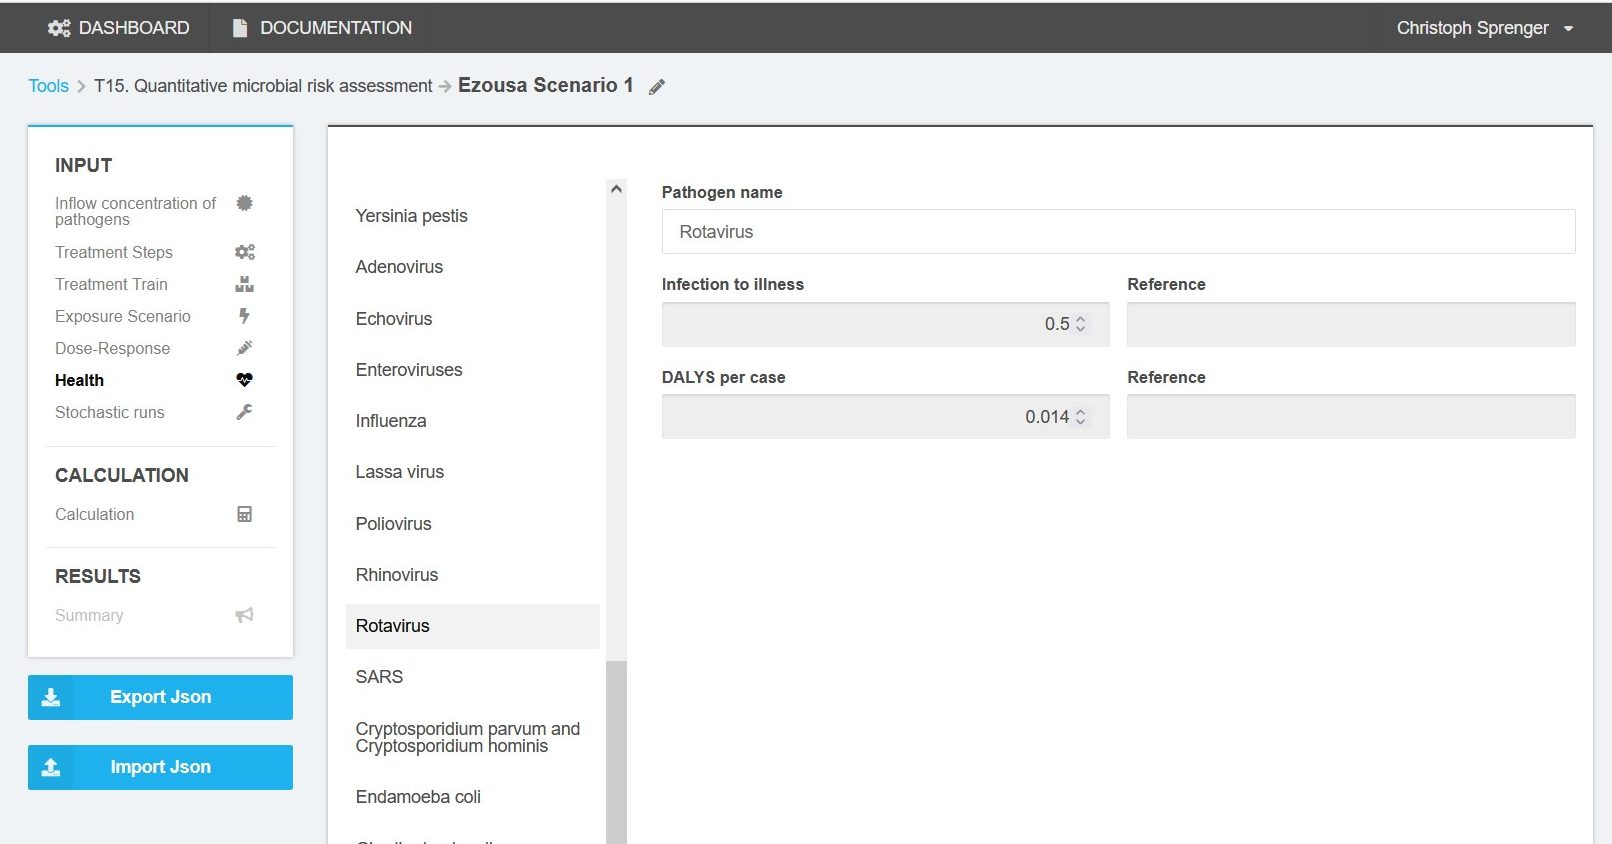
Health
For all pathogens to be used for QMRA, the infection to illness factor and the disability-adjusted life years (DALY) per case need to be defined (Figure 7).
Stochastic runs
In Monte-Carlo simulation the number of random distribution generations can be specified here. At least 1000 runs are recommended.
Calculation, results and data export
The results are presented in tables and made available for download in json and csv format. A graphical display of results is currently not available. Four files (events, total, stats_total, stats_logremoval) are available for download (Figure 8).
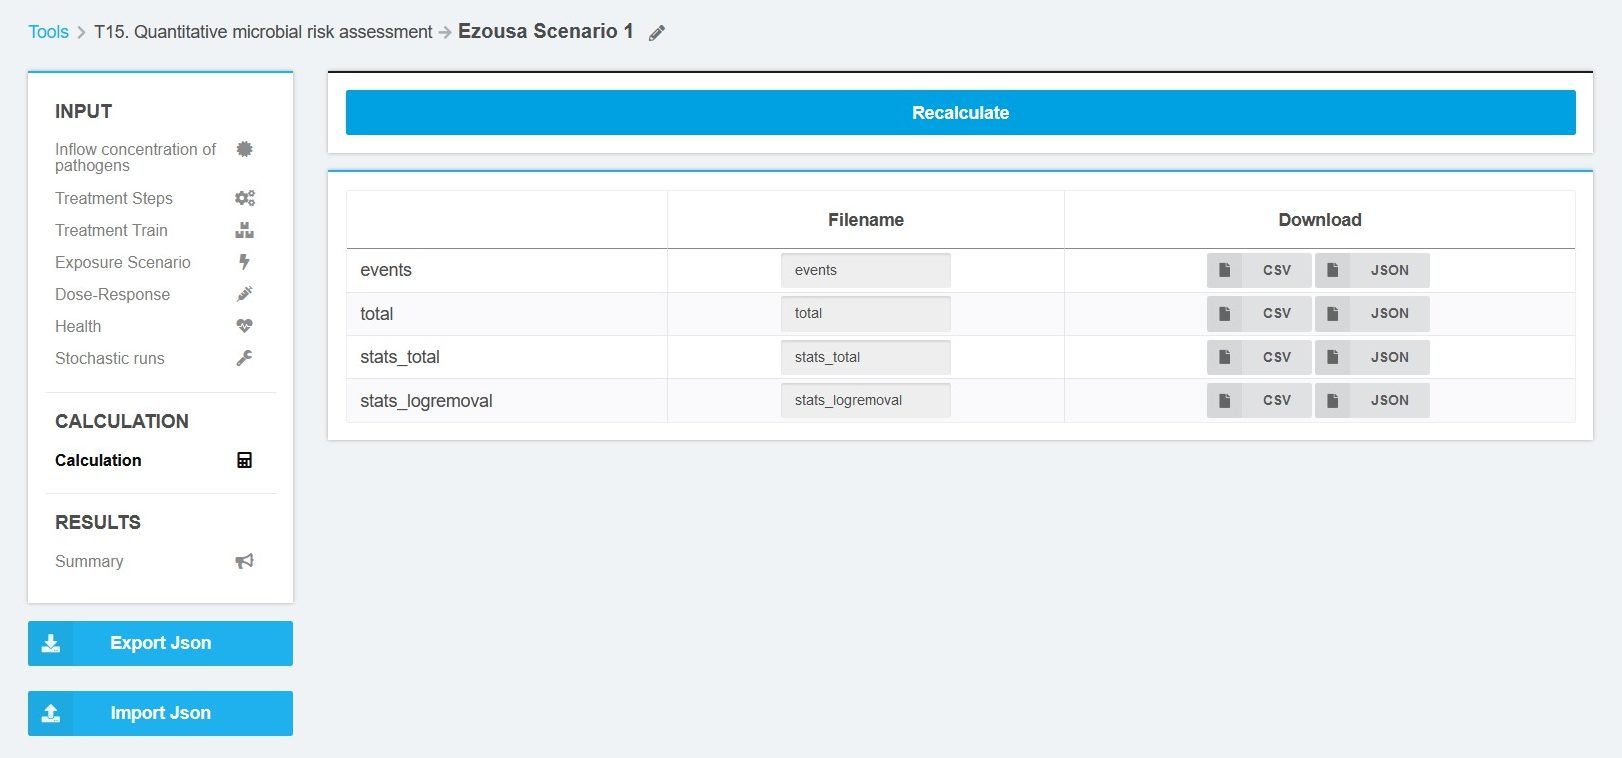
The file “events” include the calculated logreduction for each event from each pathogen group. The output file “total” contains the values of the inflow median, logreduction median, volume sum, exposure sum, dose sum, infection probability sum, illness probability sum, and dalys sum for each stochastic run from each pathogen group. The file “stats_total” include aggregated values (min, p05, p25, mean, median, p75, p95, and max) of dalys sum, dose sum, events, exposure sum, infection probability sum, illness probability sum, and dalys sum for each treatment step and pathogen group. The file “stats_logremoval” include aggregated values (min, p05, p25, mean, median, p75, p95, and max) of log removal for each treatment step and pathogen group.
References
[1]https://kwb-r.github.io/kwb.qmra/reference/create_random_distribution.html, 22.10.2021
[2]https://kwb-r.github.io/kwb.qmra/, 22.10.2021
[3]http://qmrawiki.canr.msu.edu/index.php/Dose_Response, 22.10.2021